
What is a data center heat island?
A data center heat island is an area where land and air surface temperatures are significantly higher than the surrounding areas, caused by immense waste heat discharged from massive server farms.
Imagine a giant, incredibly powerful computer, the size of a warehouse, running 24/7. It gets extremely hot and needs massive air conditioning to stay cool. The “heat island effect” is the warm air and heat exhaust from that warehouse being pumped outside, turning the local area into a “hot spot” compared to the surrounding countryside. At the same time, it is also heating the ground.
The cause
These “hyperscale” data centers store and process immense amounts of AI data. The thousands of servers working at once produce vast amounts of waste heat, which is then expelled into the atmosphere.
The impact
- Warmer temperatures. Research suggests that after a data center begins operating, nearby surface temperatures can rise by an average of 3.6°F, with some extreme cases seeing increases up to 16°F, depending on the size and amount of data centers running.
- Widespread reach. This effect doesn’t stay confined to the building. It can affect areas up to 6.2 miles (10 km) away from the facility.
- Community impact. This creates higher temperatures for nearby residents, increasing the need for air conditioning, impacting local comfort, and contributing to localized environmental changes.
In short, it is a new form of environmental impact, where the infrastructure powering artificial intelligence (AI) and the digital world literally makes the local neighborhood hotter.
How does this affect Temple?
This affects our parks, golf courses, walking trails, the entire Downtown Temple area, and the historic district.
It also affects what our homes are worth. Read about home values and taxes.
Heat maps of Rowan’s sites
These maps show two of Rowan’s project sites with a highlighted heat radius around each one.
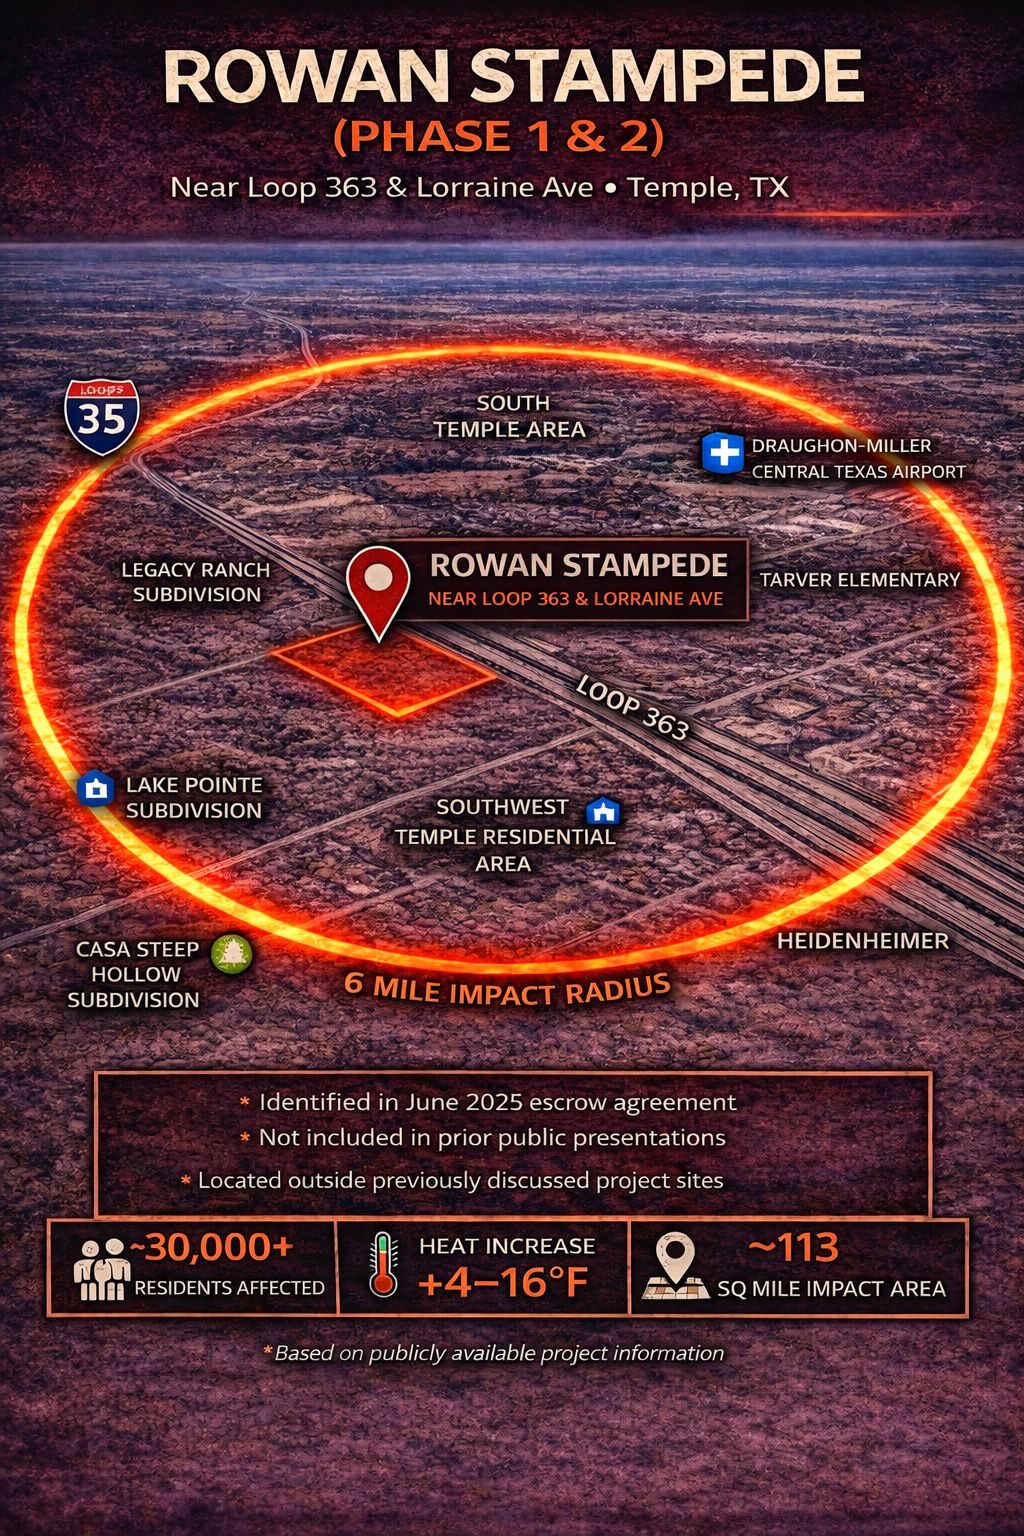
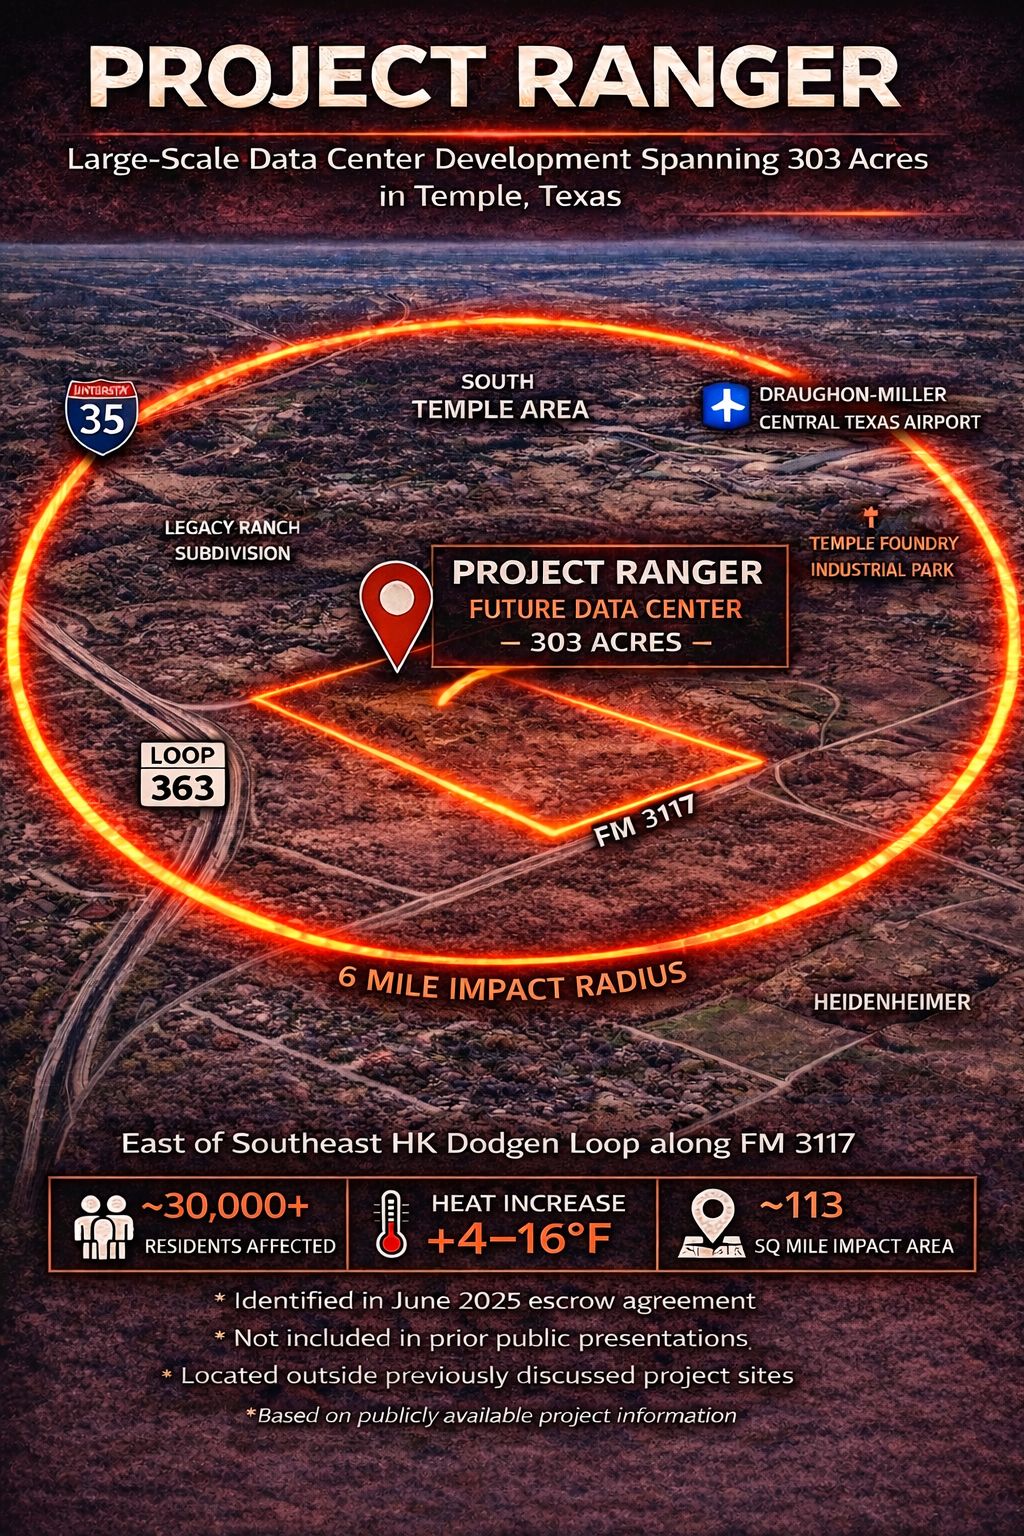
Needs reviewThe current site has a third heat map that was not included in this preview.
Do your own research
We completely believe in transparency and truth. Here are the links to where we have acquired this information for you to research yourself. Never take a corporation’s, organization’s, government, or volunteer’s word for it. Make sure you know, so we can work together as neighbors. Any facts we did not include, or that are misconstrued, we want to fix immediately, so please let us know. We are doing this together, not against anyone (well, except the billionaires; we are definitely against the billionaires).